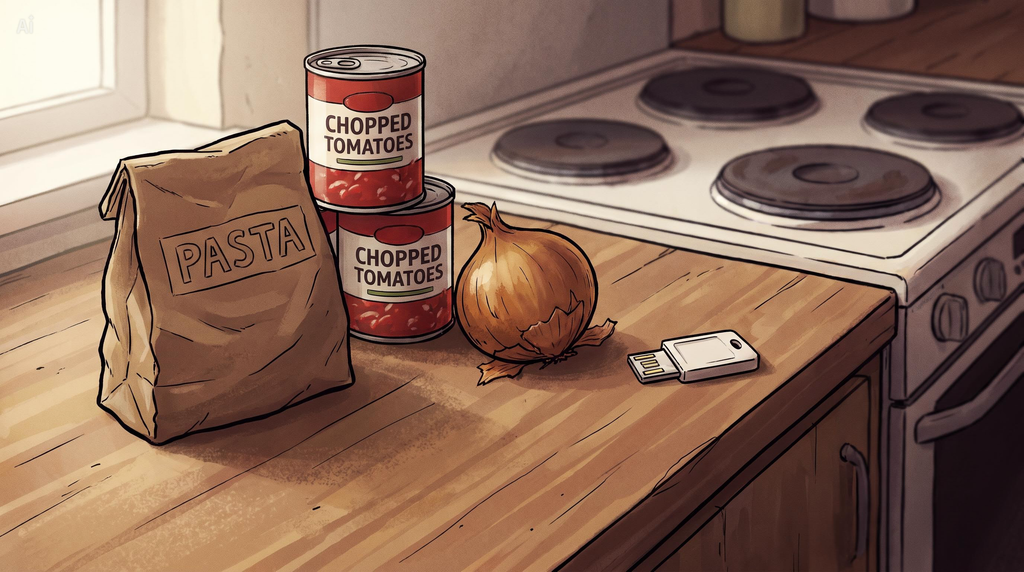
Eat better, cook from scratch, prep on a Sunday, be consistent. Sound advice, if you already have the money, the time, the kitchen and the headroom to act on it.
Steven Paul, RD. The Whole You Dietitian.
The advice everyone gets, and what it assumes
Scroll through social media and there is always a new fad for whatever healthier eating is supposed to look like this month, though it usually comes down to the same handful of instructions. Eat more of whatever is trending. Eat fresh. Cook everything from scratch. Cut out processed foods and takeaways. Move more.
The advice assumes you have money, time, a working kitchen and some energy left over at the end of the day, and a lot of people in the UK do not have all four of those things at once.
That shortfall rarely gets mentioned. Saying “you can’t afford this” or “you don’t have time for this” makes the advice harder to sell as a lifestyle, so it is easier to keep the message generic and let people assume the gap is down to effort.
This article checks five claims that come up again and again in wellness content against what the UK evidence shows.
The short answer
Money and circumstances shape what people eat and how healthy they are. That much is well established in UK research. Healthier food costs more per calorie here. Diet quality and obesity both track income and local deprivation closely. UK studies on public health campaigns suggest that advice aimed at individuals tends to help people who are already better off, while changes to prices and environments tend to help people on lower incomes more. The evidence on kitchen equipment, energy bills and stress affecting decision-making is thinner, but points the same way.
Claim one: “Eating well is cheaper than a takeaway”
The claim. You will have seen the costed recipe, the 40p dinner, the caption implying that eating badly is a choice, not a budget problem.
What the evidence shows. UK researchers tracked the price of nearly a hundred everyday foods over ten years. By the end of that period, foods classed as healthier under the government’s own nutrient scoring system cost close to £7.49 per 1,000 calories. Less healthy foods cost about £2.50 for the same amount of energy, roughly a third of the price. The gap was also growing, with healthier food prices rising faster than the rest.
Government modelling adds another layer to this. Researchers worked out that a diet meeting the Eatwell Guide could, in theory, be built for about £6 a day, close to what people already spend on average. But getting there meant changing what people currently eat quite a lot, about 50% more fruit and vegetables than the average diet contains now, a good deal more starchy food such as bread, rice and potatoes, and around half as many foods high in fat and sugar as people currently eat. That is a workable number on a spreadsheet, not a shopping list most households could switch to overnight.
Real-world estimates put the cost higher still. Families in the lowest income bracket would need to spend close to half of whatever is left after paying rent or a mortgage just to follow the Eatwell Guide. For families with children on the lowest incomes, that figure climbs to 85%, almost their entire remaining budget. The highest earners, by contrast, would need to spend about a tenth of the same amount. Those figures come from a food charity that also campaigns on this issue. What they describe is not poor budgeting, but how little is left once the rent or mortgage is paid.
A UK living standards study puts the income a single adult needs for an acceptable standard of living at £30,500 a year. Full-time work on the National Living Wage gets someone about three quarters of the way there. Out-of-work benefits get someone roughly a quarter of the way there once rent is paid. More than a third of people in the UK now fall below that living standard, and in just over half of those households, every adult is working.
What this means. One cheap recipe proves nothing. A week of meals, bought from a kitchen you already have to stock, costs more if it is healthier, and for a large share of households there is not enough spare income to absorb that cost.
Claim two: “People just need to learn to cook”
The claim. Every few years a campaign appears, usually fronted by a celebrity chef, arguing that people on low incomes eat badly because nobody taught them to cook.
What the evidence shows. A study of the UK’s National Diet and Nutrition Survey found that nine in ten adults said they could cook a main meal from basic ingredients without help. Differences between richer and poorer groups were small and inconsistent. Where a gap did appear, it was among the youngest adults and the lowest income group, and even then, it showed up as slightly lower confidence, not lower ability.
There is a real gap, but it sits in knowledge of the guidelines rather than kitchen skill. One English study found that people on lower incomes were less familiar with what current dietary guidance recommends. That is a different problem to “can’t cook”, and it needs a different solution.
What this means. The idea that low-income households lack basic cooking skills does not hold up against UK data. Campaigns built around teaching people to cook are aimed at a problem most people do not have.
Claim three: “Meal prep on a Sunday and you’re sorted”
The claim. Batch cook on your day off, fill the freezer, and the rest of the week takes care of itself.
What the evidence shows. That advice takes for granted a predictable day off, a working oven, a freezer, storage containers and a free afternoon. A UK study of how people spend their time found that women on lower incomes spent more time cooking than women on higher incomes, not less. The study did not explain the reason, though a few things point the same way. Cheaper ingredients, a bag of dried beans rather than a ready-cooked equivalent, often take longer to turn into a meal. Shift patterns, caring responsibilities and long commutes rarely line up with a tidy weekend slot either, so the time meal prep asks for may be the time people have least control over.
What this means. Time is not shared out evenly, and the people with the least of it may often be the same people being asked to spend more of it cooking, not less. Advice built around a free Sunday afternoon is not written with them in mind.
Claim four: “Buy fresh, avoid processed”
The claim. Steer clear of anything in a packet or a tin and build your meals around fresh ingredients instead.
What the evidence shows on kitchens. The advice to buy fresh assumes a working fridge, freezer and cooker, and a shop nearby that sells fresh food. Here the evidence is limited, resting mainly on estimates and surveys. One clear finding stands out. When winter weather turns unusually cold, the poorest older households cut their food spending and cut it by more than better-off households do. That study only covers older households and severe cold snaps, so it does not prove this happens routinely to working-age families, but it does confirm that people sometimes must choose between heating and food.
Estimates from 2020 suggested that close to 1.9 million people in the UK had no cooker, 900,000 had no fridge, and 2.8 million had no freezer. Separate polling found that 3.2 million people ran out of credit on a prepayment energy meter in 2022, and about one in five of those people went a full day or more without gas or electricity. No solid study directly connects a missing fridge or cooker to what people eat. The link is easy to imagine, since you cannot batch-cook without a hob or keep food fresh without a fridge, but it has not been measured, so it should be treated as a plausible gap rather than a proven one.
What the evidence shows on food shops. This part rests on stronger footing, drawing on proper reviews and studies that followed people over several years. Fast-food outlets make up about a quarter of all places to buy food in England, and more than a third in the most deprived areas, so exposure is unequal. Whether that exposure causes obesity is a separate question, and the evidence is weaker than you might expect. One UK study of working adults in Cambridgeshire found that people with more takeaways near home, work and their commute ate more takeaway food and weighed more at that point in time. Following the same people over several years, having more takeaways nearby at the start did not predict who put on more weight later. A frequently cited BMJ commentary from over twenty years ago also argued that the idea of “food deserts”, areas with no fresh food available at all, had been imported from the US into UK policy without UK evidence to back it up. The more accurate picture here is not an absence of shops, but an abundance of cheap, energy-dense options in poorer areas.
What this means. You need functioning kitchen equipment and reliable food shops before “buy fresh, avoid processed” is even possible to follow, and both are less certain for people on lower incomes. Whether the local food environment on its own drives weight gain is still genuinely unclear.
Claim five: “It’s a lifestyle, not a diet. It comes down to discipline”
The claim. Eating well is a matter of consistency and self-control, not circumstance.
What the evidence shows. UK national diet surveys show that fruit and vegetable intake rises with income across almost every age group, and so does fibre and most vitamin and mineral intake. Sugary drink consumption and added sugar intake fall as income rises. People in the lowest income group eat about two portions of fruit and vegetables a day on average, compared with close to three portions in the highest income group. About one in six people in the lowest income group eat less than one portion a day, compared with roughly one in twenty in the highest income group.
Here is the detail that undercuts the discipline argument completely. No income group meets the five-a-day target, and fibre intake falls short across the whole population, rich and poor alike. The generic advice is failing everyone. It is simply failing people on lower incomes by more.
The same pattern shows up in health outcomes. Using measured height and weight rather than self-reported figures, 22% of adults in the least deprived parts of England are living with obesity, compared with 36% in the most deprived parts. Among children finishing primary school, it is 13.5% in the least deprived areas and 29.3% in the most deprived. Twenty years ago, the gap between richer and poorer children was under ten percentage points. It is now nearly sixteen. Two decades of “eat well” public health messaging have run alongside a widening gap, not a shrinking one.
Food insecurity, meaning not being able to reliably get enough food because of money, adds to this picture. About a quarter of adults in England, Wales and Northern Ireland reported being food insecure in late 2023, up from close to one in seven two years earlier.
What this means. A gap this large and this consistent, across income levels, across decades, and across both diet and body weight, has far more to do with circumstance than character.
What works instead
A UK review sorted different types of healthy eating intervention by how they worked. Price measures, such as taxing less healthy food or subsidising healthier food, tended to help people on lower incomes the most. Every intervention that combined a tax with a subsidy narrowed the gap between richer and poorer groups. Measures aimed at individuals, such as health education campaigns and dietary counselling, tended to help people who were already better off. Every counselling-based intervention in that review looked likely to make that gap wider, not smaller.
That review has limits. It could not combine the results into a single overall figure, several of the price studies were computer models rather than real-world trials, and the pattern weakened once only the strongest studies were included. Even so, it lines up with what happened when the UK tried a price-based policy. The sugar levy on soft drinks is the clearest example. The first published analysis of its effect overstated the result due to a calculation error and was later corrected. The corrected figure shows a smaller drop in sugar purchases than first reported, but the pattern by income held up. The biggest reductions happened in the two most deprived income groups, and a fall in childhood obesity was concentrated among girls from the most deprived areas.
Even help specifically aimed at low-income families runs into the same problem when people have to find it and apply for it themselves. Healthy Start gives eligible low-income families a card to spend on fruit, vegetables, milk and formula. About a third of eligible families in England are not claiming it, which adds up to close to £45 million a year going unclaimed. Support that depends on someone hearing about it, applying online and getting through the process tends to reach people who already have the capacity to manage all of that.
Who the current message serves
None of this happens by chance. Life expectancy in the poorest tenth of areas in England is now 9.5 years shorter for men and 7.7 years shorter for women than in the richest tenth, and that gap has widened over the past decade. In the poorest areas, life expectancy for women has fallen.
Against that backdrop, a wellness message that assumes everyone has a full fridge and a free Sunday is not a neutral message. It suits businesses selling that lifestyle. It flatters people who already have the money and time to follow it. And it leaves everyone else thinking the problem is them, when the evidence points somewhere else.
The British Dietetic Association’s position on food poverty is that dietitians should help people identify what support they are entitled to and eat as well as they can on the income they have, while also arguing for change to the conditions that put them there in the first place.
The same pattern shows up outside the UK
Everything above is UK evidence, kept that way on purpose, because a UK problem needs a UK-specific answer. It is still worth knowing that none of this is unique to Britain, though the size of some of these effects may differ from one country to the next, since income, food prices and social support all work differently.
Studies covering ten high-income countries find the same cost gap between healthier and less healthy diets that UK data show. Research from France reaches the same conclusion using entirely different pricing data. Large reviews spanning multiple countries link food insecurity with higher rates of obesity in adults, though most of that research only captures a single point in time rather than following people for years, and the same link does not appear in children. A review of cooking classes, mostly run in the US, found the same pattern as the UK cooking-skills research, improved confidence and reported eating habits, but no measurable change in blood pressure, cholesterol or weight. Australian research following working adults over several years found that being short on money and being short on time each independently reduce healthy eating and physical activity, and that longer working hours and commutes push people towards buying food rather than cooking it. International reviews covering well over a hundred studies mostly find no clear link between the number of fast-food outlets nearby and obesity rates, echoing the UK’s own uncertain findings. And a set of experiments carried out with shoppers in the US and farmers in India suggested that financial stress itself damages people’s ability to think clearly and plan ahead, an idea that a later reanalysis could not fully reproduce, and that a large follow-up study only partly supported.
None of that changes the UK findings above. It shows that the underlying problems, cost, time, insecurity, and the limits of advice aimed at individuals, are not unique to Britain, which makes them harder to dismiss as a local excuse.
The takeaway
Five claims that come up again and again in wellness content do not hold up against the evidence. Healthy food does cost more. Cooking skill is rarely the real barrier. Time is unevenly shared, not a matter of willpower. Fresh, unprocessed food depends on having a working kitchen and a decent shop nearby. And a health divide this wide and this consistent fits circumstance far better than it fits discipline.
A lot of healthy eating content is built to sell something, a programme, a product, a following, and admitting how much money, time and kitchen access someone needs before the advice even applies would undercut the sale. It is easier and more convenient to leave those conditions out and let the advice look like it works for everyone.
Left out like that, the people who cannot follow the advice are left to draw their own conclusions about why. Too often, the conclusion is that they are not trying hard enough, when the more accurate answer is that the advice was never built with their situation in mind. Believing the first version of that story, rather than the second, does nothing to close the gap it describes.
This article explains what the evidence shows in general. It is not personalised advice, and it cannot take account of your own situation, health or household.
If you are looking to improve your diet and lifestyle within the resources you actually have, that is exactly what a registered dietitian specialises in.
If you know someone who is fed up with being told to “just eat better”, feel free to share this with them.
This content is for educational and informational purposes only and does not substitute for professional medical advice, diagnosis, or treatment.
References
Adams, J., Goffe, L., Adamson, A.J. et al. (2015) ‘Prevalence and socio-demographic correlates of cooking skills in UK adults: cross-sectional analysis of data from the UK National Diet and Nutrition Survey’, International Journal of Behavioral Nutrition and Physical Activity, 12, 99. doi:10.1186/s12966-015-0261-x
Adams, J. and White, M. (2015) ‘Prevalence and socio-demographic correlates of time spent cooking by adults in the 2005 UK Time Use Survey’, Appetite. doi:10.1016/j.appet.2015.05.022
Beatty, T.K.M., Blow, L. and Crossley, T.F. (2014) ‘Is there a “heat-or-eat” trade-off in the UK?’, Journal of the Royal Statistical Society: Series A, 177(1), pp. 281–294. doi:10.1111/rssa.12013
British Dietetic Association (2020) Policy Statement: Food Poverty. https://www.bda.uk.com/resource/food-poverty.html
Burgoine, T., Forouhi, N.G., Griffin, S.J., Wareham, N.J. and Monsivais, P. (2014) ‘Associations between exposure to takeaway food outlets, takeaway food consumption, and body weight in Cambridgeshire, UK’, BMJ, 348, g1464. doi:10.1136/bmj.g1464
Citizens Advice (2023) Prepayment meter self-disconnection polling, Yonder, December 2022.
Cobb, L.K., Appel, L.J., Franco, M. et al. (2015) ‘The relationship of the local food environment with obesity: a systematic review of methods, study quality, and results’, Obesity, 23(7), pp. 1331–1344. doi:10.1002/oby.21118
Cummins, S. and Macintyre, S. (2002) ‘”Food deserts”: evidence and assumption in health policy making’, BMJ, 325(7361), pp. 436–438. doi:10.1136/bmj.325.7361.436
Darmon, N. and Drewnowski, A. (2015) ‘Contribution of food prices and diet cost to socioeconomic disparities in diet quality and health: a systematic review and analysis’, Nutrition Reviews, 73(10), pp. 643–660. doi:10.1093/nutrit/nuv027
Eskandari, F. et al. (2022) ‘A mixed-method systematic review and meta-analysis of the influences of food environments and food insecurity on obesity in high-income countries’, Food Science & Nutrition. doi:10.1002/fsn3.2969
Food Foundation (2026) The Broken Plate 2026. London: Food Foundation.
Food Standards Agency (2024) Food and You 2: Wave 8.
Hasan, B., Thompson, W.G., Almasri, J. et al. (2019) ‘The effect of culinary interventions (cooking classes) on dietary intake and behavioral change: a systematic review and evidence map’, BMC Nutrition, 5, 29. doi:10.1186/s40795-019-0293-8
‘The Healthy Start scheme in England “is a lifeline for families but many are missing out”: a rapid qualitative analysis’ (2024) BMC Medicine. doi:10.1186/s12916-024-03380-5
Hoenink, J.C., Panter, J., Adams, J., Burgoine, T. et al. (2024) ‘Associations of takeaway outlets with takeaway food consumption and adiposity: longitudinal analysis of the Fenland cohort’, Obesity. doi:10.1002/oby.24152
Institute of Health Equity (2020) Health Equity in England: The Marmot Review 10 Years On. London: Institute of Health Equity.
Jones, N.R.V., Conklin, A.I., Suhrcke, M. and Monsivais, P. (2014) ‘The growing price gap between more and less healthy foods: analysis of a novel longitudinal UK dataset’, PLoS ONE, 9(10), e109343. doi:10.1371/journal.pone.0109343
Joseph Rowntree Foundation (2025) A Minimum Income Standard for the United Kingdom in 2025. York: JRF.
Mani, A., Mullainathan, S., Shafir, E. and Zhao, J. (2013) ‘Poverty impedes cognitive function’, Science, 341(6149), pp. 976–980. doi:10.1126/science.1238041
McGill, R., Anwar, E., Orton, L. et al. (2015) ‘Are interventions to promote healthy eating equally effective for all? Systematic review of socioeconomic inequalities in impact’, BMC Public Health, 15, 457. doi:10.1186/s12889-015-1781-7
Moosavian, S.P., Awlqadr, F.H., Mehrabani, S. et al. (2026) ‘The association between food insecurity and adverse health outcomes in adults: an umbrella review’, Nutrition Reviews, 84(7), pp. 1387–1400. doi:10.1093/nutrit/nuaf136
Moradi, S., Mirzababaei, A., Dadfarma, A. et al. (2019) ‘Food insecurity and adult weight abnormality risk: a systematic review and meta-analysis’, European Journal of Nutrition, 58(1), pp. 45–61. doi:10.1007/s00394-018-1819-6
NHS England (2024) Health Survey for England 2022, Part 2: Adult overweight and obesity.
O’Donnell, M., Dev, A.S., Antonoplis, S. et al. (2021) ‘Empirical audit and review and an assessment of evidentiary value in research on the psychological consequences of scarcity’, PNAS, 118(44), e2103313118. doi:10.1073/pnas.2103313118
Office for Health Improvement and Disparities (2025) National Child Measurement Programme, England, 2024/25 school year.
Oostenbach, L.H., Lamb, K.E., Crawford, D. and Thornton, L. (2022) ‘Influence of work hours and commute time on food practices: a longitudinal analysis of the Household, Income and Labour Dynamics in Australia Survey’, BMJ Open, 12, e056212. doi:10.1136/bmjopen-2021-056212
Parmenter, K., Waller, J. and Wardle, J. (2000) ‘Demographic variation in nutrition knowledge in England’, Health Education Research, 15(2), pp. 163–174. doi:10.1093/her/15.2.163
Public Health England (2019) National Diet and Nutrition Survey Years 1 to 9: time trend and income analyses.
Rao, M., Afshin, A., Singh, G. and Mozaffarian, D. (2013) ‘Do healthier foods and diet patterns cost more than less healthy options? A systematic review and meta-analysis’, BMJ Open, 3(12), e004277. doi:10.1136/bmjopen-2013-004277
Rogers, N.T., Pell, D., Mytton, O.T. et al. (2023) ‘Changes in soft drinks purchased by British households associated with the UK soft drinks industry levy’, BMJ Open, 13, e077059.
Rogers, N.T. et al. (2023) ‘Associations between trajectories of obesity prevalence in English primary school children and the UK soft drinks industry levy’, PLoS Medicine, 20, e1004160.
Rogers, N.T. et al. (2023) ‘Impact of the UK soft drinks industry levy on health and health inequalities in children and adolescents in England’, PLoS Medicine, 20, e1004371.
Scarborough, P., Kaur, A., Cobiac, L. et al. (2016) ‘Eatwell Guide: modelling the dietary and cost implications of incorporating new sugar and fibre guidelines’, BMJ Open, 6(12), e013182. doi:10.1136/bmjopen-2016-013182
Turn2us (2020) Living Without: The Scale and Impact of Appliance Poverty. London: Turn2us.
Venn, D. and Strazdins, L. (2017) ‘Your money or your time? How both types of scarcity matter to physical activity and healthy eating’, Social Science & Medicine, 172, pp. 98–106. doi:10.1016/j.socscimed.2016.10.023
Wicherts, J.M. and Scholten, A.Z. (2013) ‘Comment on “Poverty impedes cognitive function”‘, Science, 342(6163), 1169. doi:10.1126/science.1246680
Wilkins, E., Radley, D., Morris, M. et al. (2019) ‘A systematic review employing the GeoFERN framework to examine methods, reporting quality and associations between the Retail Food Environment and obesity’, Health & Place, 57, pp. 186–199.